Descriptive Statistics — III
- Median from Histogram
Calculating Median from a range of values is simple. Recall from a range of values [10,12,13,15,17,20,21] = the median is 15 i.e., the centre value
Now how do we calculate median from a Histogram
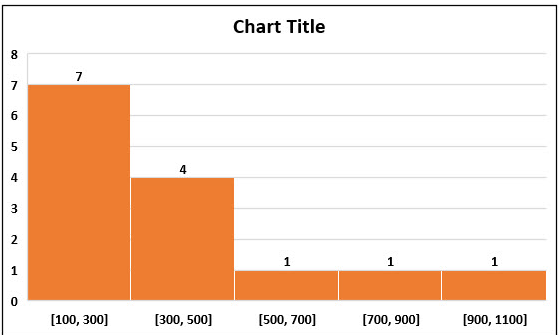
Say a Histogram of values


Consider the 1st and 2nd column.We have 5 bins of values with number of stocks and its price range. How do we calculate the Median from this Histogram
Step 1: Calculate cumulative frequency for the number of stocks — column 3
Step 2: Take the last value of cum. Frequency which is 17. If even use n/2, (n+1)/2 else if odd use (n+1)/2. 17 is odd , so (17 + 1)/2 = 9
Step 3: Find which price range contains the value 9 , which is 100–300
Step 4 : Find the mid range (100 + 300)\2 = 200 which is our median
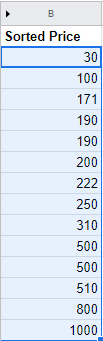
For the what would be the median for actual values, Below is the original data

There are 14 values , Median is [(n/2) +( (n/2)+1)]/2 = [(14/2) + ((14/2) + 1)] = 7th + 8th element which is (200 + 222 )/2 = 422/2 = 211.
The median computed from Histogram is 200 and from actual value is 222 . The difference is (222–200)/222*100 = 9.9 % away from actual median, which is minor
2. Mean from Histogram
Lets calculate Mean from Hisogram

Consider column A and B
Step 1: Calculate mid point of range. If range is 100–300 , midpoint is 200 (Column c)
Step 2: Multiply Mid pint range with number of stocks = 200 * 10 = 2000 (Column D)
Step 3 : (Sum column D )/(Sum of column B) = 6000/17 = 352.94
The mean is 352.94 . Now to verify we can see what would be the mean if calculated from actual values

Mean is 4973/14 = 355.21
The comparison of mean calculated from actual values 355.21 and from Histogram is 352.94 . (355.21–352.94)/355.21 * 100 = 0.63 % away from actual mean
3. Mode from Histogram
Can you check this Histogram and tell what is the mode .
.
.
.
.
.
.
On a first look it shows 100–300 is the mode as there are more number of items in that range. Actually they are more number of values and not the same values. So what is the mode then. You can tell from the actual data
They are 190 and 500. So how do you find this in a Histogram. The answer is we cant find mode from a Histogram, unless the bin size is 1
